An ecommerce TikTok content audit starts with a decision, not a list of viral clips. Pick one public account and a defined sample, sort the posts you can see, then verify the source videos before writing a creative brief. In the 13 Gymshark TikTok posts checked for this example, the median visible view count was 64,800. The largest was 1,100,000. Those numbers describe this sample on October 12, 2026; they do not prove why a post reached more people.
Gymshark identifies @gymshark as its official TikTok account in its official account list. This is an independent research example, not a Gymshark collaboration or endorsement.
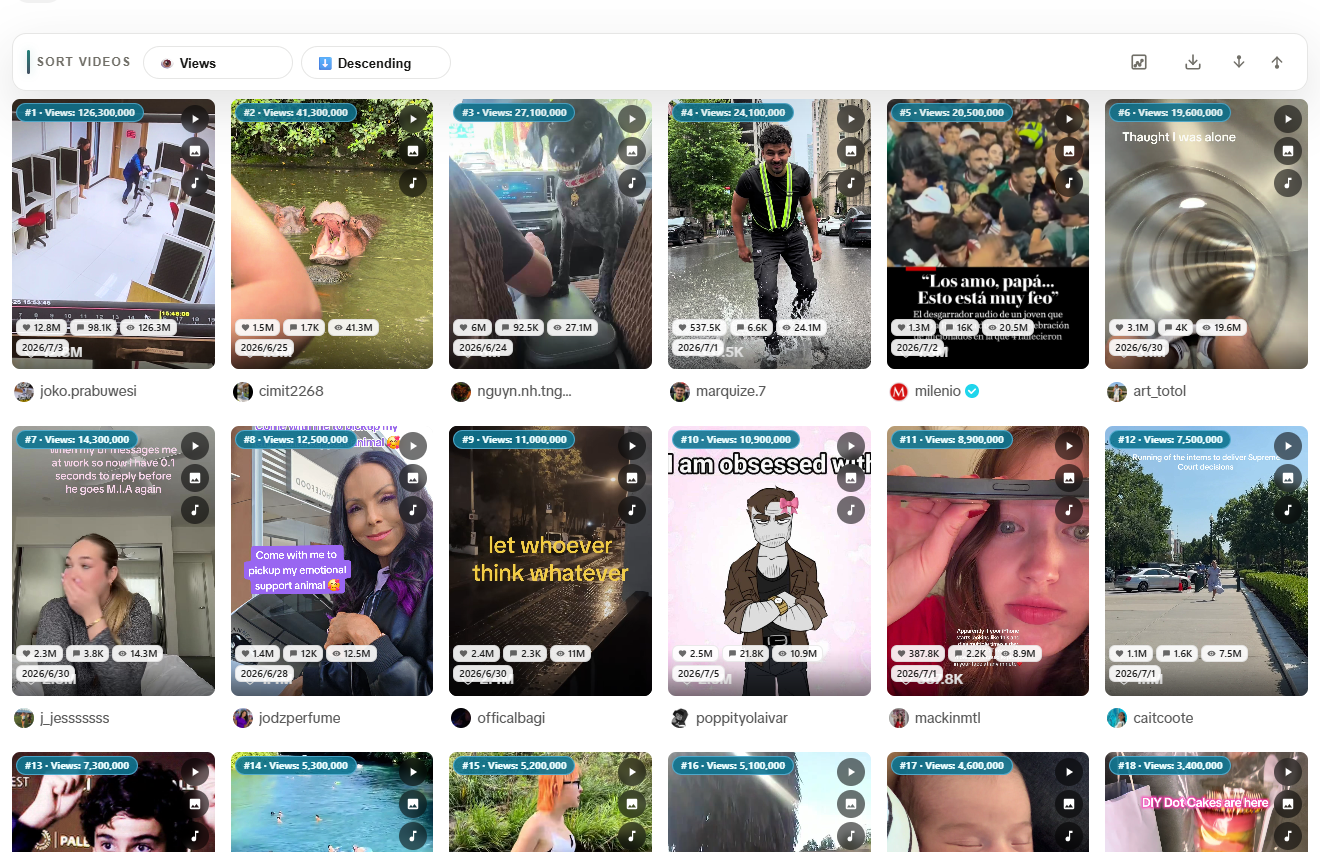
Interface example only. The audit numbers below come from the linked Gymshark post pages, not from this screenshot or a Sort Feed export.
The question: which videos deserve a closer creative review?
Suppose an activewear team is preparing its next short-video brief. It wants to find public posts worth watching and compare their caption themes, athlete participation, and opening seconds. Visible views provide a useful first sort, but a view count is not an order count, a conversion rate, or a measure of audience fit.
For this example, we selected 13 publicly reachable posts by one account, published from September 27 through October 9, 2026. We checked each original TikTok post page on October 12, 2026 and recorded its displayed views, likes, and comments. This is a small, non-random sample, not the account's complete history. Posts had different amounts of time to collect views. Counts can change after the check date, and we cannot see whether distribution was paid or organic.
The 13-post source snapshot
Each link opens the original TikTok post used for that row. Caption labels below are short identifiers, not a judgment about the video itself.
| Posted (UTC) | Post | Views | Likes | Comments |
|---|---|---|---|---|
| Oct 9 | Season changed | 23,900 | 1,346 | 36 |
| Oct 8 | Time to lock in | 68,800 | 9,408 | 92 |
| Oct 7 | Winter changes the routine | 54,300 | 7,021 | 46 |
| Oct 6 | Refuse to choose | 29,400 | 2,078 | 46 |
| Oct 5 | Aesthetic of consistency | 829,400 | 171,500 | 855 |
| Oct 4 | In routine | 44,300 | 4,127 | 72 |
| Oct 3 | Only competition is you | 258,300 | 39,100 | 113 |
| Oct 1 | Winter arc is here | 73,800 | 8,926 | 55 |
| Sep 30 | Winter arc is coming | 214,400 | 44,200 | 303 |
| Sep 29 | Winter arc is loading | 1,100,000 | 206,200 | 539 |
| Sep 28 | Luke Elsman collaboration | 44,800 | 1,738 | 17 |
| Sep 27 | Ryan Terry feature | 64,800 | 2,415 | 34 |
| Sep 27 | Analytical system | 46,900 | 2,515 | 18 |
The median of these 13 view counts is 64,800. The September 29 post's 1,100,000 views are about 17 times that median; the October 5 post's 829,400 views are about 12.8 times it. Eight sampled captions contain #winterarc, yet their visible views range from 23,900 to 1,100,000. A repeated campaign label alone does not explain the difference.
These are descriptive comparisons within the selected rows. The newest post had less time to accumulate views than the oldest. Do not turn this table into an account-wide engagement rate, a sales estimate, or a claim that one caption format caused the result.
Reproduce the audit with Sort Feed
- Write the question: for example, "Which public videos from this brand should our team watch before briefing a seasonal activewear campaign?"
- Open a supported TikTok profile grid in desktop Chrome. Load the posts that fit your stated date range, then sort the visible grid by Views, descending. The sorting guide covers the controls.
- Record the source page and check date. Open the shortlisted post URLs and verify the visible counts. Use the post export workflow if your team needs a CSV snapshot.
- Watch both high-view and ordinary posts before labeling their first seconds, format, product treatment, athlete involvement, and CTA. Captions and counts alone cannot establish those creative features.
- Write a brief with a test to run on your own channel and a metric you can actually observe there.
Sort Feed can sort and export fields visible in your supported browser session. The numbers in this article were checked directly on public TikTok post pages; we did not claim to run the extension on Gymshark's profile for this dataset.
Turn the shortlist into three tests
The table suggests questions for an ecommerce team to investigate, not ready-made answers:
| Question to inspect in the source videos | Test on your own account | What to measure |
|---|---|---|
| Do the high-view campaign posts reveal the seasonal premise earlier than the ordinary posts? | Try two openings for the same seasonal product story. | Your own retention and qualified product visits. |
| How is an athlete or creator introduced in the high-view posts? | Compare a creator-led opening with a product-led opening. | Your own completed views and product-page visits. |
| Does the video show the apparel in use, or rely on a broader motivation theme? | Brief one demonstration and one theme-led cut. | Your own audience response and downstream actions. |
Those tests require watching the posts and using your own analytics to evaluate the outcome. A competitor's public view count cannot tell you which concept will sell your product.
One-page creative brief template
Brand/account reviewed:
Research question:
Post date range:
Page URL and check date:
Metric used for the first sort:
Number of loaded posts and exclusions:

Source URLs to inspect:
High-view example and visible count:
Ordinary comparison and visible count:
What the videos actually show in the first seconds:
Differences that might matter:
What public data cannot tell us:

Hypothesis for our next test:
Creative owner and launch date:
First-party success metric:
Date to review the result:
Start with a ranked shortlist, then inspect the videos and write a test your team can evaluate. For a broader method, see the competitor research workflow; for the tool's exact support and limits, see the TikTok sorter page.